Remote Debugging with Safari Web Inspector / Chrome Developer Tools
 Did you know that you can debug remotely with WebKit Web Inspector?
Here is how:
– Start your web browser with the remote-debugging-port command line switch and open preferred pages.
Chromium –remote-debugging-port=9222
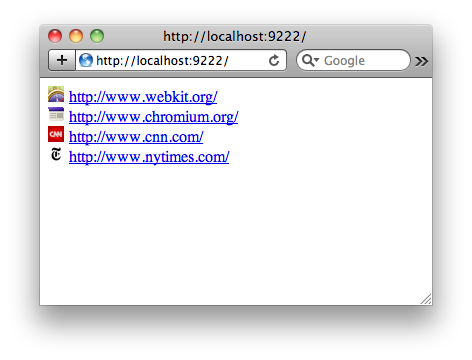
– Using other web browser, navigate to the given port and you should see all the opened pages from other web browser as web links:

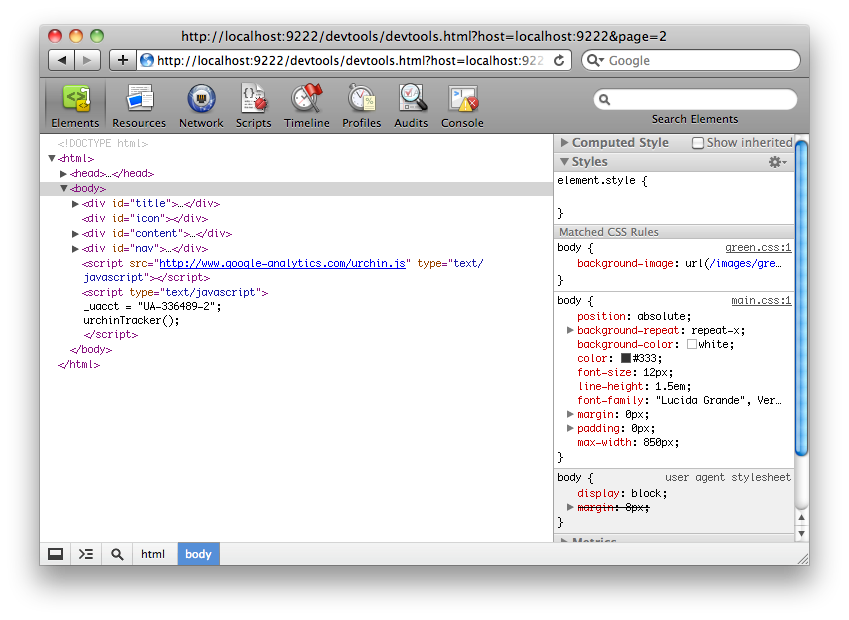
– Just hit on one of those links and start debugging.
Here is how everything works:
Target browser acts as a web server bound to the port 9222 on the localhost.
Once you follow the link, your client browser fetches HTML, JavaScript and CSS files of the Web Inspector front-end over HTTP. Chromium serves as a web server in this case.
Upon load event, Web Inspector establishes Web Socket connection back to the target browser and starts interchanging JSON messages with it.
Source: WebKit
About (Author Profile)
Vygantas is a former web designer whose projects are used by companies such as AMD, NVIDIA and departed Westood Studios. Being passionate about software, Vygantas began his journalism career back in 2007 when he founded FavBrowser.com. Having said that, he is also an adrenaline junkie who enjoys good books, fitness activities and Forex trading.


Not nearly as impressive as Opera’s Dragonfly debugging, that allows remote debuging of desktop AND mobile devices….
http://dev.opera.com/articles/view/remote-debugging-with-opera-dragonfly/